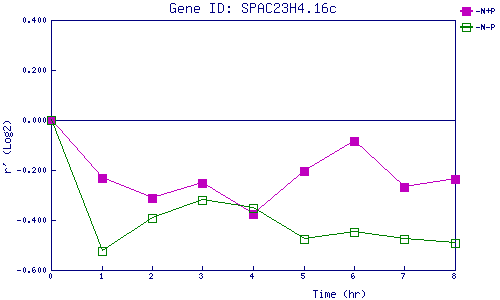
| 0 | 1 | 2 | 3 | 4 | 5 | 6 | 7 | 8 | |
| -N+P | 0.000 | -0.231 | -0.314 | -0.253 | -0.377 | -0.203 | -0.084 | -0.267 | -0.237 |
| -N-P | 0.000 | -0.525 | -0.390 | -0.319 | -0.353 | -0.475 | -0.448 | -0.475 | -0.493 |
|
-N+P: Nitrogen starved in the presence of P-factor -N-P: Nitrogen starved in the absence of P-factor |