srb10
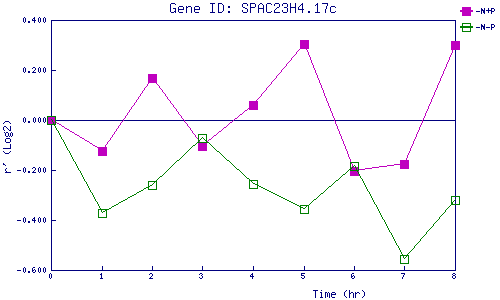
| 0 | 1 | 2 | 3 | 4 | 5 | 6 | 7 | 8 | |
| -N+P | 0.000 | -0.124 | 0.167 | -0.106 | 0.060 | 0.304 | -0.203 | -0.176 | 0.300 |
| -N-P | 0.000 | -0.371 | -0.261 | -0.072 | -0.255 | -0.356 | -0.184 | -0.556 | -0.322 |
|
-N+P: Nitrogen starved in the presence of P-factor -N-P: Nitrogen starved in the absence of P-factor |