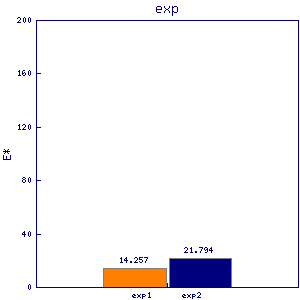
pip1
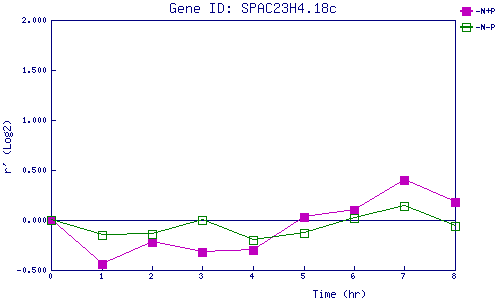
| 0 | 1 | 2 | 3 | 4 | 5 | 6 | 7 | 8 | |
| -N+P | 0.000 | -0.438 | -0.225 | -0.319 | -0.302 | 0.031 | 0.096 | 0.403 | 0.185 |
| -N-P | 0.000 | -0.146 | -0.145 | -0.003 | -0.203 | -0.131 | 0.017 | 0.142 | -0.055 |
|
-N+P: Nitrogen starved in the presence of P-factor -N-P: Nitrogen starved in the absence of P-factor |