sty1 spc1 phh1
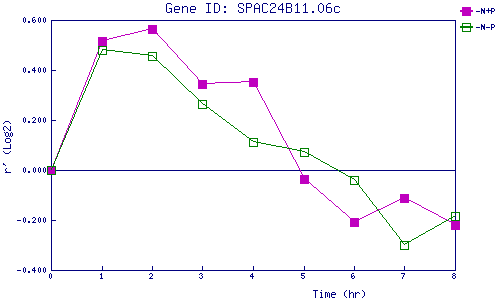
| 0 | 1 | 2 | 3 | 4 | 5 | 6 | 7 | 8 | |
| -N+P | 0.000 | 0.515 | 0.563 | 0.346 | 0.351 | -0.036 | -0.209 | -0.110 | -0.219 |
| -N-P | 0.000 | 0.482 | 0.456 | 0.265 | 0.111 | 0.073 | -0.041 | -0.300 | -0.182 |
|
-N+P: Nitrogen starved in the presence of P-factor -N-P: Nitrogen starved in the absence of P-factor |