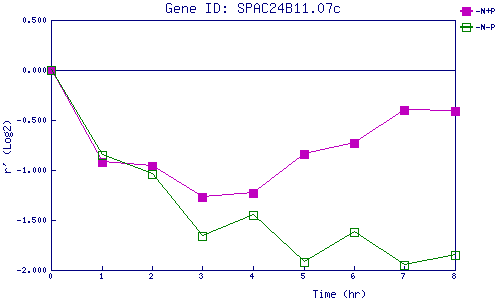
| 0 | 1 | 2 | 3 | 4 | 5 | 6 | 7 | 8 | |
| -N+P | 0.000 | -0.923 | -0.957 | -1.270 | -1.232 | -0.845 | -0.728 | -0.404 | -0.413 |
| -N-P | 0.000 | -0.854 | -1.045 | -1.661 | -1.453 | -1.921 | -1.622 | -1.954 | -1.854 |
|
-N+P: Nitrogen starved in the presence of P-factor -N-P: Nitrogen starved in the absence of P-factor |