| 0 | 1 | 2 | 3 | 4 | 5 | 6 | 7 | 8 | |
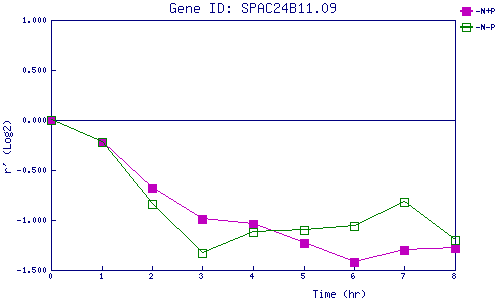
| -N+P | 0.000 | -0.220 | -0.681 | -0.986 | -1.040 | -1.232 | -1.418 | -1.304 | -1.275 |
| -N-P | 0.000 | -0.225 | -0.841 | -1.328 | -1.117 | -1.103 | -1.062 | -0.822 | -1.203 |
|
-N+P: Nitrogen starved in the presence of P-factor -N-P: Nitrogen starved in the absence of P-factor |