reserved_name_cfh1
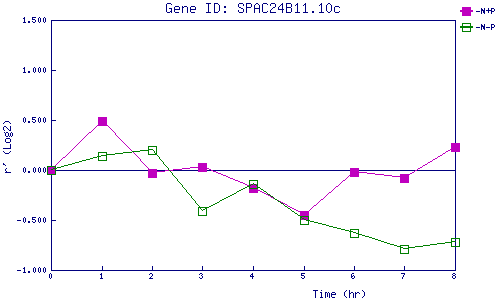
| 0 | 1 | 2 | 3 | 4 | 5 | 6 | 7 | 8 | |
| -N+P | 0.000 | 0.487 | -0.027 | 0.034 | -0.182 | -0.453 | -0.015 | -0.079 | 0.230 |
| -N-P | 0.000 | 0.135 | 0.198 | -0.406 | -0.137 | -0.505 | -0.633 | -0.790 | -0.722 |
|
-N+P: Nitrogen starved in the presence of P-factor -N-P: Nitrogen starved in the absence of P-factor |