cut11
| 0 | 1 | 2 | 3 | 4 | 5 | 6 | 7 | 8 | |
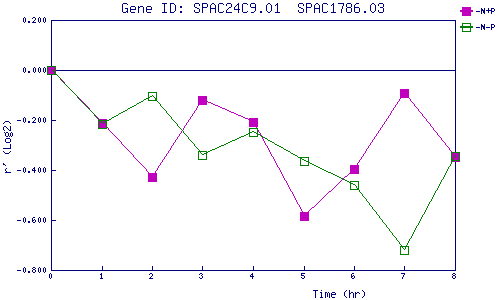
| -N+P | 0.000 | -0.213 | -0.429 | -0.118 | -0.208 | -0.582 | -0.395 | -0.092 | -0.348 |
| -N-P | 0.000 | -0.214 | -0.104 | -0.340 | -0.248 | -0.365 | -0.460 | -0.718 | -0.344 |
|
-N+P: Nitrogen starved in the presence of P-factor -N-P: Nitrogen starved in the absence of P-factor |
