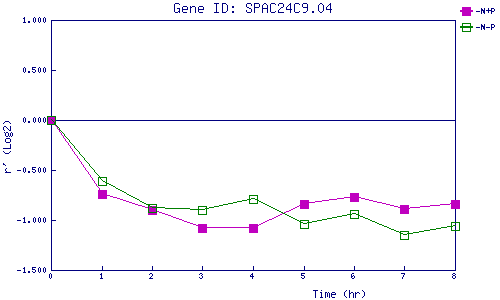
| 0 | 1 | 2 | 3 | 4 | 5 | 6 | 7 | 8 | |
| -N+P | 0.000 | -0.743 | -0.903 | -1.076 | -1.077 | -0.837 | -0.770 | -0.892 | -0.841 |
| -N-P | 0.000 | -0.612 | -0.885 | -0.900 | -0.788 | -1.044 | -0.941 | -1.151 | -1.063 |
|
-N+P: Nitrogen starved in the presence of P-factor -N-P: Nitrogen starved in the absence of P-factor |