bgs2 meu21
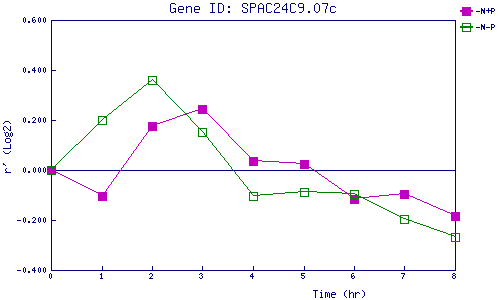
| 0 | 1 | 2 | 3 | 4 | 5 | 6 | 7 | 8 | |
| -N+P | 0.000 | -0.102 | 0.176 | 0.244 | 0.036 | 0.026 | -0.115 | -0.098 | -0.182 |
| -N-P | 0.000 | 0.200 | 0.360 | 0.153 | -0.105 | -0.089 | -0.097 | -0.197 | -0.269 |
|
-N+P: Nitrogen starved in the presence of P-factor -N-P: Nitrogen starved in the absence of P-factor |