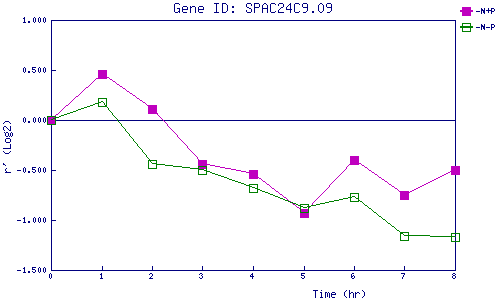
| 0 | 1 | 2 | 3 | 4 | 5 | 6 | 7 | 8 | |
| -N+P | 0.000 | 0.463 | 0.110 | -0.438 | -0.542 | -0.933 | -0.402 | -0.754 | -0.499 |
| -N-P | 0.000 | 0.185 | -0.438 | -0.500 | -0.683 | -0.880 | -0.767 | -1.163 | -1.171 |
|
-N+P: Nitrogen starved in the presence of P-factor -N-P: Nitrogen starved in the absence of P-factor |