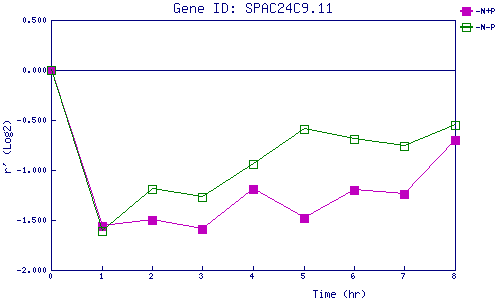
| 0 | 1 | 2 | 3 | 4 | 5 | 6 | 7 | 8 | |
| -N+P | 0.000 | -1.555 | -1.502 | -1.589 | -1.190 | -1.476 | -1.200 | -1.245 | -0.700 |
| -N-P | 0.000 | -1.610 | -1.189 | -1.267 | -0.943 | -0.590 | -0.686 | -0.761 | -0.554 |
|
-N+P: Nitrogen starved in the presence of P-factor -N-P: Nitrogen starved in the absence of P-factor |