| 0 | 1 | 2 | 3 | 4 | 5 | 6 | 7 | 8 | |
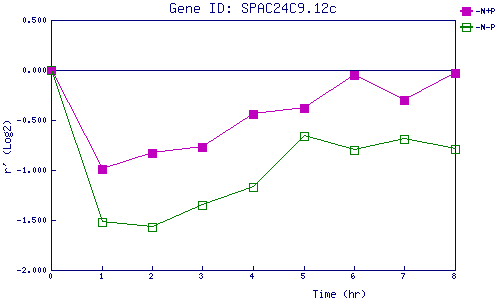
| -N+P | 0.000 | -0.989 | -0.830 | -0.767 | -0.443 | -0.384 | -0.052 | -0.299 | -0.030 |
| -N-P | 0.000 | -1.516 | -1.567 | -1.349 | -1.167 | -0.658 | -0.800 | -0.691 | -0.787 |
|
-N+P: Nitrogen starved in the presence of P-factor -N-P: Nitrogen starved in the absence of P-factor |