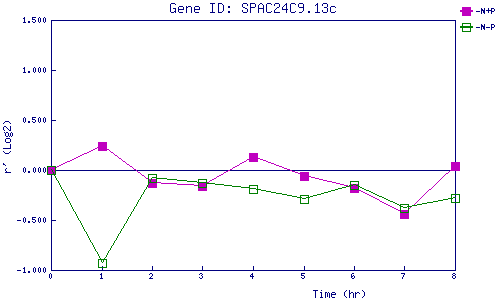
| 0 | 1 | 2 | 3 | 4 | 5 | 6 | 7 | 8 | |
| -N+P | 0.000 | 0.245 | -0.129 | -0.158 | 0.128 | -0.065 | -0.177 | -0.441 | 0.038 |
| -N-P | 0.000 | -0.926 | -0.077 | -0.130 | -0.186 | -0.292 | -0.151 | -0.382 | -0.276 |
|
-N+P: Nitrogen starved in the presence of P-factor -N-P: Nitrogen starved in the absence of P-factor |