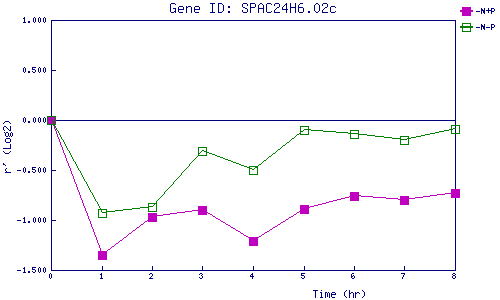
| 0 | 1 | 2 | 3 | 4 | 5 | 6 | 7 | 8 | |
| -N+P | 0.000 | -1.351 | -0.968 | -0.896 | -1.206 | -0.890 | -0.757 | -0.800 | -0.729 |
| -N-P | 0.000 | -0.929 | -0.869 | -0.310 | -0.495 | -0.096 | -0.141 | -0.204 | -0.089 |
|
-N+P: Nitrogen starved in the presence of P-factor -N-P: Nitrogen starved in the absence of P-factor |