pcu3
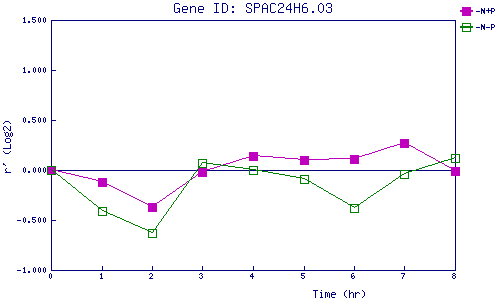
| 0 | 1 | 2 | 3 | 4 | 5 | 6 | 7 | 8 | |
| -N+P | 0.000 | -0.116 | -0.369 | -0.022 | 0.145 | 0.101 | 0.106 | 0.272 | -0.011 |
| -N-P | 0.000 | -0.413 | -0.628 | 0.066 | 0.002 | -0.094 | -0.375 | -0.042 | 0.119 |
|
-N+P: Nitrogen starved in the presence of P-factor -N-P: Nitrogen starved in the absence of P-factor |