sld3
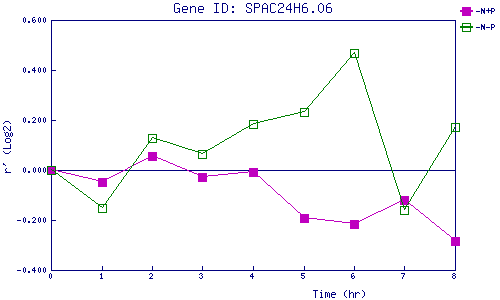
| 0 | 1 | 2 | 3 | 4 | 5 | 6 | 7 | 8 | |
| -N+P | 0.000 | -0.050 | 0.057 | -0.027 | -0.006 | -0.193 | -0.214 | -0.120 | -0.283 |
| -N-P | 0.000 | -0.154 | 0.130 | 0.063 | 0.185 | 0.234 | 0.467 | -0.159 | 0.172 |
|
-N+P: Nitrogen starved in the presence of P-factor -N-P: Nitrogen starved in the absence of P-factor |