rps9a rps9-1 rps901
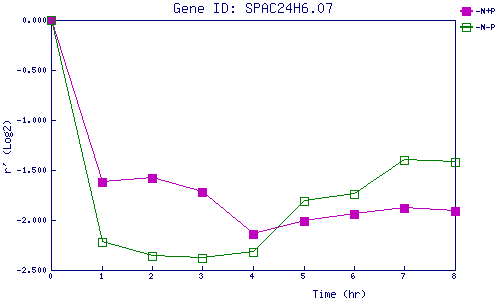
| 0 | 1 | 2 | 3 | 4 | 5 | 6 | 7 | 8 | |
| -N+P | 0.000 | -1.618 | -1.583 | -1.723 | -2.145 | -2.011 | -1.935 | -1.885 | -1.906 |
| -N-P | 0.000 | -2.224 | -2.358 | -2.381 | -2.324 | -1.807 | -1.741 | -1.405 | -1.417 |
|
-N+P: Nitrogen starved in the presence of P-factor -N-P: Nitrogen starved in the absence of P-factor |