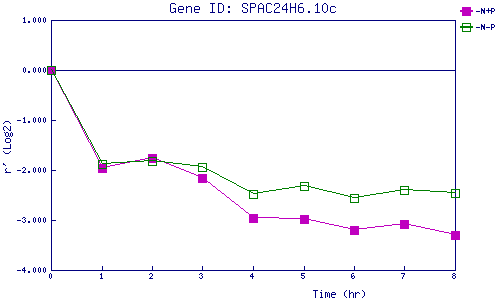
| 0 | 1 | 2 | 3 | 4 | 5 | 6 | 7 | 8 | |
| -N+P | 0.000 | -1.960 | -1.762 | -2.162 | -2.961 | -2.989 | -3.198 | -3.087 | -3.302 |
| -N-P | 0.000 | -1.877 | -1.820 | -1.949 | -2.477 | -2.310 | -2.554 | -2.406 | -2.463 |
|
-N+P: Nitrogen starved in the presence of P-factor -N-P: Nitrogen starved in the absence of P-factor |