uba3
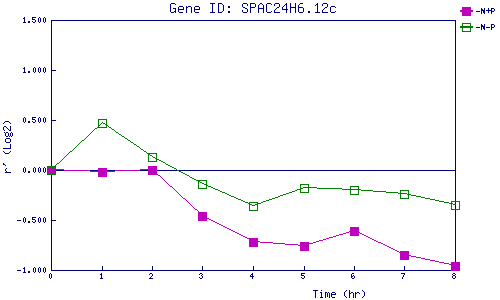
| 0 | 1 | 2 | 3 | 4 | 5 | 6 | 7 | 8 | |
| -N+P | 0.000 | -0.025 | 0.005 | -0.464 | -0.723 | -0.759 | -0.611 | -0.847 | -0.958 |
| -N-P | 0.000 | 0.473 | 0.126 | -0.135 | -0.361 | -0.180 | -0.200 | -0.242 | -0.350 |
|
-N+P: Nitrogen starved in the presence of P-factor -N-P: Nitrogen starved in the absence of P-factor |