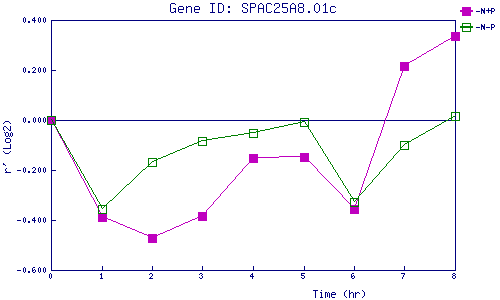
| 0 | 1 | 2 | 3 | 4 | 5 | 6 | 7 | 8 | |
| -N+P | 0.000 | -0.387 | -0.471 | -0.384 | -0.152 | -0.149 | -0.357 | 0.216 | 0.337 |
| -N-P | 0.000 | -0.356 | -0.167 | -0.083 | -0.051 | -0.009 | -0.326 | -0.099 | 0.017 |
|
-N+P: Nitrogen starved in the presence of P-factor -N-P: Nitrogen starved in the absence of P-factor |