| 0 | 1 | 2 | 3 | 4 | 5 | 6 | 7 | 8 | |
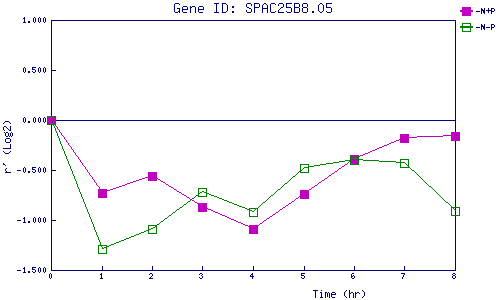
| -N+P | 0.000 | -0.729 | -0.561 | -0.874 | -1.092 | -0.743 | -0.394 | -0.182 | -0.160 |
| -N-P | 0.000 | -1.292 | -1.090 | -0.716 | -0.918 | -0.483 | -0.397 | -0.434 | -0.906 |
|
-N+P: Nitrogen starved in the presence of P-factor -N-P: Nitrogen starved in the absence of P-factor |