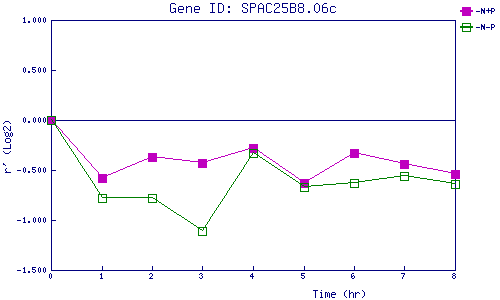
| 0 | 1 | 2 | 3 | 4 | 5 | 6 | 7 | 8 | |
| -N+P | 0.000 | -0.584 | -0.366 | -0.427 | -0.280 | -0.626 | -0.326 | -0.436 | -0.536 |
| -N-P | 0.000 | -0.781 | -0.785 | -1.107 | -0.334 | -0.668 | -0.634 | -0.563 | -0.639 |
|
-N+P: Nitrogen starved in the presence of P-factor -N-P: Nitrogen starved in the absence of P-factor |