| 0 | 1 | 2 | 3 | 4 | 5 | 6 | 7 | 8 | |
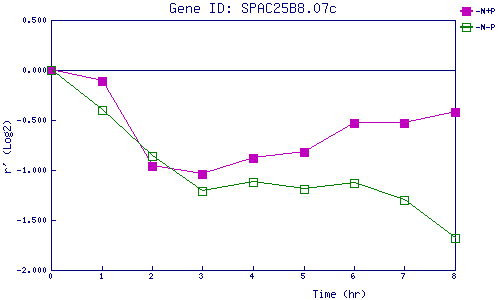
| -N+P | 0.000 | -0.106 | -0.957 | -1.042 | -0.878 | -0.823 | -0.534 | -0.531 | -0.417 |
| -N-P | 0.000 | -0.396 | -0.860 | -1.207 | -1.125 | -1.192 | -1.129 | -1.304 | -1.683 |
|
-N+P: Nitrogen starved in the presence of P-factor -N-P: Nitrogen starved in the absence of P-factor |