| 0 | 1 | 2 | 3 | 4 | 5 | 6 | 7 | 8 | |
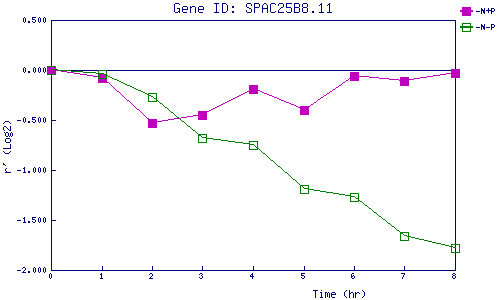
| -N+P | 0.000 | -0.079 | -0.534 | -0.449 | -0.189 | -0.397 | -0.059 | -0.114 | -0.027 |
| -N-P | 0.000 | -0.045 | -0.267 | -0.684 | -0.754 | -1.189 | -1.267 | -1.657 | -1.782 |
|
-N+P: Nitrogen starved in the presence of P-factor -N-P: Nitrogen starved in the absence of P-factor |