mal2
| 0 | 1 | 2 | 3 | 4 | 5 | 6 | 7 | 8 | |
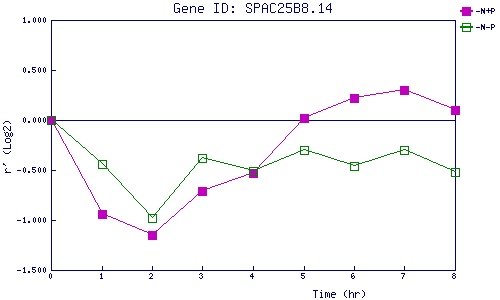
| -N+P | 0.000 | -0.940 | -1.147 | -0.712 | -0.528 | 0.017 | 0.218 | 0.302 | 0.099 |
| -N-P | 0.000 | -0.436 | -0.978 | -0.377 | -0.508 | -0.295 | -0.462 | -0.300 | -0.523 |
|
-N+P: Nitrogen starved in the presence of P-factor -N-P: Nitrogen starved in the absence of P-factor |
