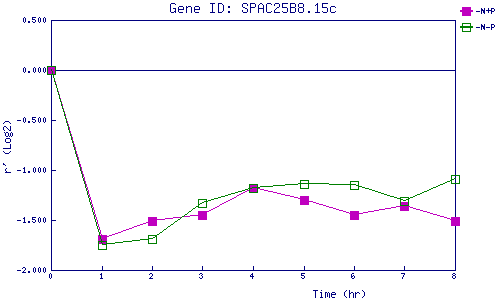
| 0 | 1 | 2 | 3 | 4 | 5 | 6 | 7 | 8 | |
| -N+P | 0.000 | -1.691 | -1.513 | -1.447 | -1.180 | -1.299 | -1.452 | -1.365 | -1.514 |
| -N-P | 0.000 | -1.748 | -1.690 | -1.328 | -1.179 | -1.136 | -1.148 | -1.307 | -1.087 |
|
-N+P: Nitrogen starved in the presence of P-factor -N-P: Nitrogen starved in the absence of P-factor |