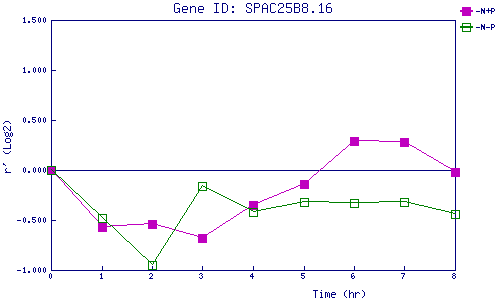
| 0 | 1 | 2 | 3 | 4 | 5 | 6 | 7 | 8 | |
| -N+P | 0.000 | -0.574 | -0.544 | -0.679 | -0.353 | -0.143 | 0.292 | 0.276 | -0.025 |
| -N-P | 0.000 | -0.478 | -0.948 | -0.160 | -0.418 | -0.315 | -0.331 | -0.323 | -0.439 |
|
-N+P: Nitrogen starved in the presence of P-factor -N-P: Nitrogen starved in the absence of P-factor |