| 0 | 1 | 2 | 3 | 4 | 5 | 6 | 7 | 8 | |
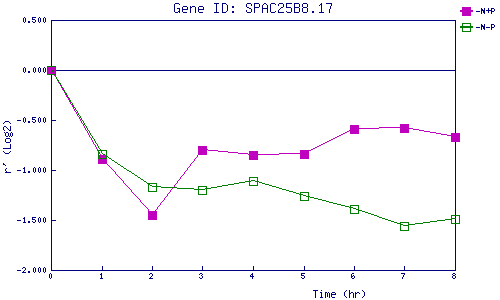
| -N+P | 0.000 | -0.890 | -1.451 | -0.805 | -0.851 | -0.841 | -0.593 | -0.585 | -0.668 |
| -N-P | 0.000 | -0.844 | -1.172 | -1.198 | -1.112 | -1.263 | -1.392 | -1.560 | -1.490 |
|
-N+P: Nitrogen starved in the presence of P-factor -N-P: Nitrogen starved in the absence of P-factor |