ydc2
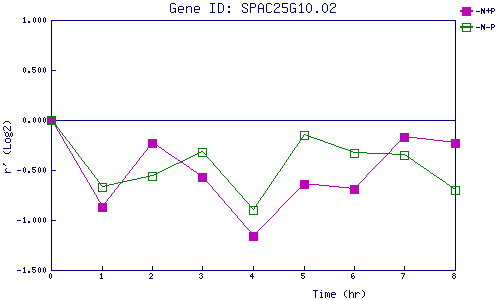
| 0 | 1 | 2 | 3 | 4 | 5 | 6 | 7 | 8 | |
| -N+P | 0.000 | -0.868 | -0.232 | -0.572 | -1.158 | -0.638 | -0.688 | -0.173 | -0.227 |
| -N-P | 0.000 | -0.666 | -0.564 | -0.319 | -0.901 | -0.148 | -0.326 | -0.351 | -0.697 |
|
-N+P: Nitrogen starved in the presence of P-factor -N-P: Nitrogen starved in the absence of P-factor |