his1
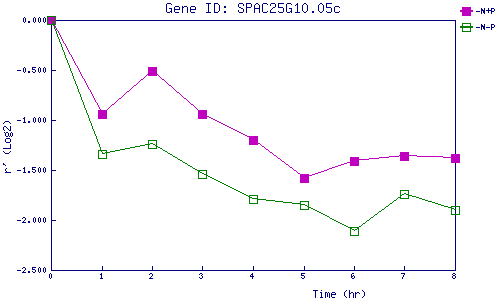
| 0 | 1 | 2 | 3 | 4 | 5 | 6 | 7 | 8 | |
| -N+P | 0.000 | -0.942 | -0.507 | -0.944 | -1.204 | -1.583 | -1.412 | -1.355 | -1.383 |
| -N-P | 0.000 | -1.344 | -1.245 | -1.541 | -1.786 | -1.853 | -2.107 | -1.744 | -1.900 |
|
-N+P: Nitrogen starved in the presence of P-factor -N-P: Nitrogen starved in the absence of P-factor |