| 0 | 1 | 2 | 3 | 4 | 5 | 6 | 7 | 8 | |
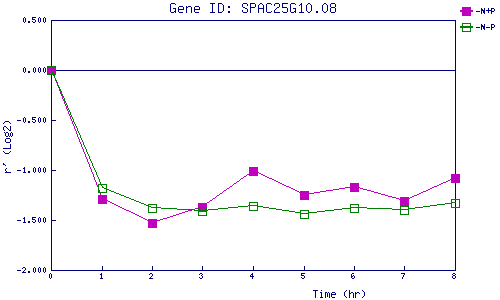
| -N+P | 0.000 | -1.289 | -1.533 | -1.373 | -1.010 | -1.247 | -1.171 | -1.308 | -1.080 |
| -N-P | 0.000 | -1.180 | -1.380 | -1.410 | -1.359 | -1.438 | -1.385 | -1.401 | -1.328 |
|
-N+P: Nitrogen starved in the presence of P-factor -N-P: Nitrogen starved in the absence of P-factor |