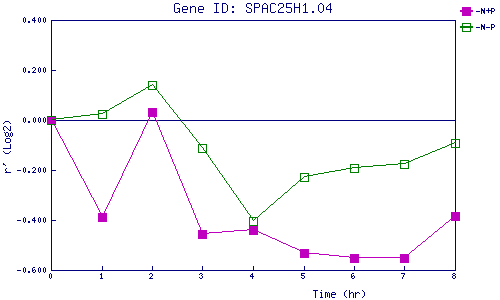
| 0 | 1 | 2 | 3 | 4 | 5 | 6 | 7 | 8 | |
| -N+P | 0.000 | -0.388 | 0.030 | -0.454 | -0.438 | -0.533 | -0.552 | -0.550 | -0.382 |
| -N-P | 0.000 | 0.022 | 0.140 | -0.112 | -0.403 | -0.229 | -0.190 | -0.175 | -0.093 |
|
-N+P: Nitrogen starved in the presence of P-factor -N-P: Nitrogen starved in the absence of P-factor |