meu29
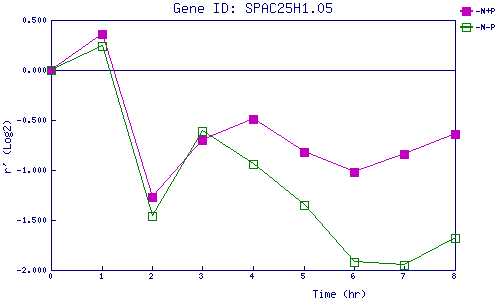
| 0 | 1 | 2 | 3 | 4 | 5 | 6 | 7 | 8 | |
| -N+P | 0.000 | 0.365 | -1.273 | -0.701 | -0.487 | -0.818 | -1.025 | -0.841 | -0.635 |
| -N-P | 0.000 | 0.239 | -1.464 | -0.614 | -0.944 | -1.350 | -1.922 | -1.948 | -1.680 |
|
-N+P: Nitrogen starved in the presence of P-factor -N-P: Nitrogen starved in the absence of P-factor |