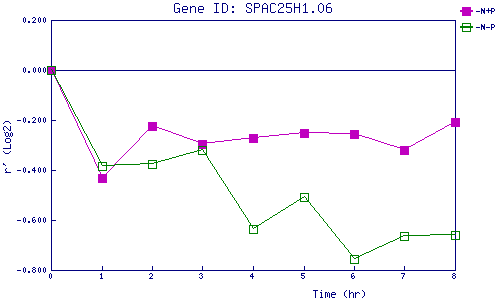
| 0 | 1 | 2 | 3 | 4 | 5 | 6 | 7 | 8 | |
| -N+P | 0.000 | -0.434 | -0.225 | -0.296 | -0.270 | -0.253 | -0.254 | -0.318 | -0.208 |
| -N-P | 0.000 | -0.385 | -0.375 | -0.321 | -0.635 | -0.509 | -0.755 | -0.664 | -0.660 |
|
-N+P: Nitrogen starved in the presence of P-factor -N-P: Nitrogen starved in the absence of P-factor |