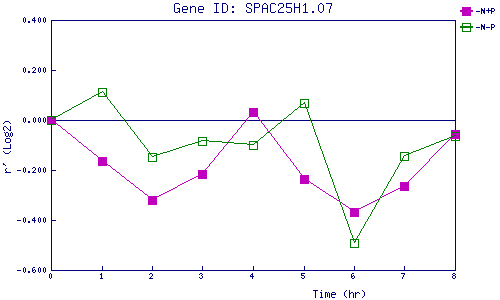
| 0 | 1 | 2 | 3 | 4 | 5 | 6 | 7 | 8 | |
| -N+P | 0.000 | -0.164 | -0.319 | -0.218 | 0.033 | -0.236 | -0.370 | -0.266 | -0.058 |
| -N-P | 0.000 | 0.112 | -0.148 | -0.084 | -0.101 | 0.068 | -0.491 | -0.144 | -0.063 |
|
-N+P: Nitrogen starved in the presence of P-factor -N-P: Nitrogen starved in the absence of P-factor |