myh myh1
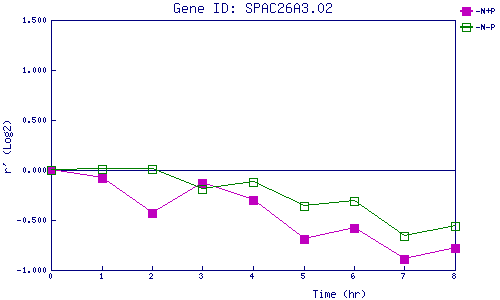
| 0 | 1 | 2 | 3 | 4 | 5 | 6 | 7 | 8 | |
| -N+P | 0.000 | -0.080 | -0.430 | -0.131 | -0.302 | -0.692 | -0.585 | -0.889 | -0.781 |
| -N-P | 0.000 | 0.007 | 0.013 | -0.193 | -0.119 | -0.362 | -0.314 | -0.662 | -0.564 |
|
-N+P: Nitrogen starved in the presence of P-factor -N-P: Nitrogen starved in the absence of P-factor |