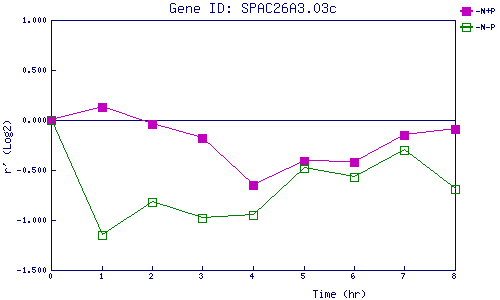
| 0 | 1 | 2 | 3 | 4 | 5 | 6 | 7 | 8 | |
| -N+P | 0.000 | 0.134 | -0.036 | -0.180 | -0.650 | -0.409 | -0.421 | -0.147 | -0.087 |
| -N-P | 0.000 | -1.154 | -0.822 | -0.980 | -0.948 | -0.475 | -0.566 | -0.300 | -0.694 |
|
-N+P: Nitrogen starved in the presence of P-factor -N-P: Nitrogen starved in the absence of P-factor |