| 0 | 1 | 2 | 3 | 4 | 5 | 6 | 7 | 8 | |
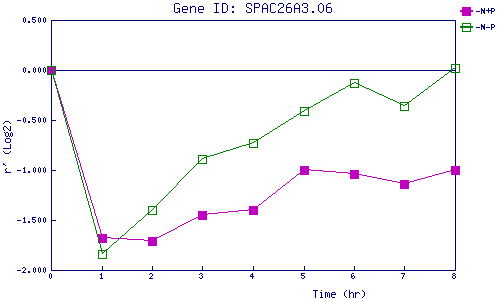
| -N+P | 0.000 | -1.681 | -1.706 | -1.452 | -1.403 | -0.996 | -1.040 | -1.137 | -1.001 |
| -N-P | 0.000 | -1.838 | -1.404 | -0.891 | -0.728 | -0.409 | -0.130 | -0.358 | 0.024 |
|
-N+P: Nitrogen starved in the presence of P-factor -N-P: Nitrogen starved in the absence of P-factor |