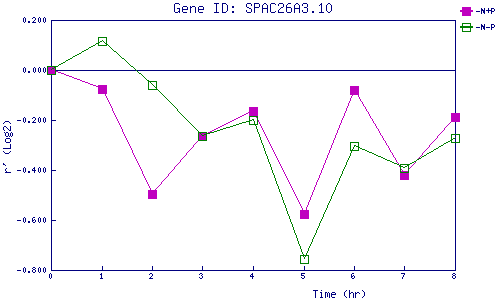
| 0 | 1 | 2 | 3 | 4 | 5 | 6 | 7 | 8 | |
| -N+P | 0.000 | -0.076 | -0.494 | -0.262 | -0.163 | -0.574 | -0.081 | -0.419 | -0.188 |
| -N-P | 0.000 | 0.115 | -0.059 | -0.266 | -0.199 | -0.755 | -0.304 | -0.391 | -0.272 |
|
-N+P: Nitrogen starved in the presence of P-factor -N-P: Nitrogen starved in the absence of P-factor |