dhp1 Tf2-4
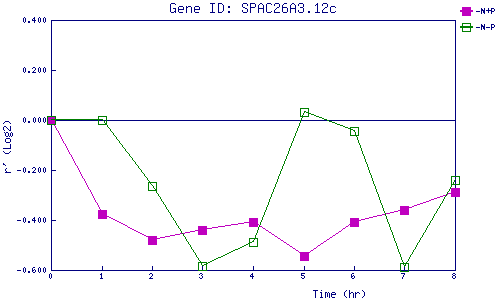
| 0 | 1 | 2 | 3 | 4 | 5 | 6 | 7 | 8 | |
| -N+P | 0.000 | -0.377 | -0.478 | -0.442 | -0.409 | -0.544 | -0.409 | -0.361 | -0.289 |
| -N-P | 0.000 | 0.002 | -0.262 | -0.586 | -0.486 | 0.032 | -0.045 | -0.588 | -0.239 |
|
-N+P: Nitrogen starved in the presence of P-factor -N-P: Nitrogen starved in the absence of P-factor |