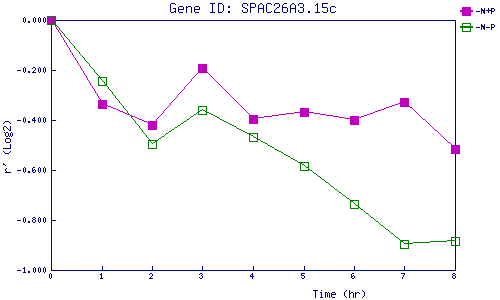
| 0 | 1 | 2 | 3 | 4 | 5 | 6 | 7 | 8 | |
| -N+P | 0.000 | -0.335 | -0.421 | -0.191 | -0.396 | -0.367 | -0.399 | -0.330 | -0.515 |
| -N-P | 0.000 | -0.244 | -0.495 | -0.361 | -0.467 | -0.586 | -0.738 | -0.895 | -0.883 |
|
-N+P: Nitrogen starved in the presence of P-factor -N-P: Nitrogen starved in the absence of P-factor |