gpm1
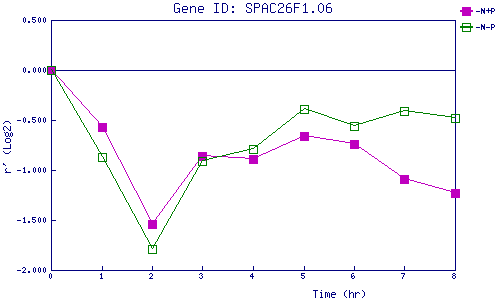
| 0 | 1 | 2 | 3 | 4 | 5 | 6 | 7 | 8 | |
| -N+P | 0.000 | -0.574 | -1.536 | -0.864 | -0.889 | -0.663 | -0.741 | -1.087 | -1.227 |
| -N-P | 0.000 | -0.868 | -1.792 | -0.907 | -0.791 | -0.393 | -0.559 | -0.410 | -0.480 |
|
-N+P: Nitrogen starved in the presence of P-factor -N-P: Nitrogen starved in the absence of P-factor |