| 0 | 1 | 2 | 3 | 4 | 5 | 6 | 7 | 8 | |
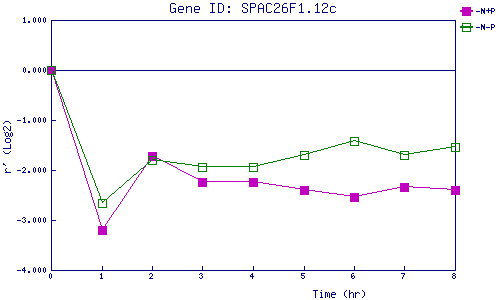
| -N+P | 0.000 | -3.206 | -1.729 | -2.235 | -2.247 | -2.406 | -2.540 | -2.345 | -2.390 |
| -N-P | 0.000 | -2.662 | -1.796 | -1.941 | -1.947 | -1.692 | -1.424 | -1.709 | -1.532 |
|
-N+P: Nitrogen starved in the presence of P-factor -N-P: Nitrogen starved in the absence of P-factor |