| 0 | 1 | 2 | 3 | 4 | 5 | 6 | 7 | 8 | |
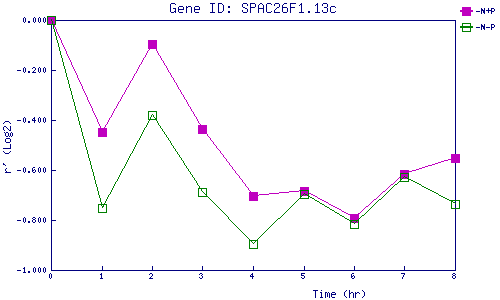
| -N+P | 0.000 | -0.447 | -0.098 | -0.436 | -0.704 | -0.685 | -0.791 | -0.614 | -0.553 |
| -N-P | 0.000 | -0.752 | -0.380 | -0.687 | -0.897 | -0.697 | -0.817 | -0.629 | -0.736 |
|
-N+P: Nitrogen starved in the presence of P-factor -N-P: Nitrogen starved in the absence of P-factor |