Sp-snR56-sno
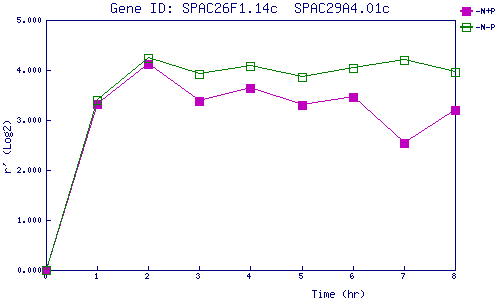
| 0 | 1 | 2 | 3 | 4 | 5 | 6 | 7 | 8 | |
| -N+P | 0.000 | 3.317 | 4.116 | 3.384 | 3.642 | 3.295 | 3.460 | 2.539 | 3.192 |
| -N-P | 0.000 | 3.399 | 4.244 | 3.929 | 4.086 | 3.851 | 4.032 | 4.190 | 3.959 |
|
-N+P: Nitrogen starved in the presence of P-factor -N-P: Nitrogen starved in the absence of P-factor |