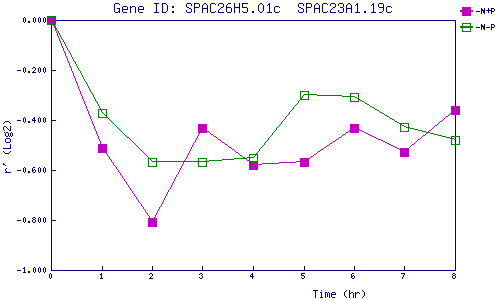
| 0 | 1 | 2 | 3 | 4 | 5 | 6 | 7 | 8 | |
| -N+P | 0.000 | -0.510 | -0.807 | -0.434 | -0.581 | -0.570 | -0.434 | -0.526 | -0.362 |
| -N-P | 0.000 | -0.373 | -0.568 | -0.570 | -0.550 | -0.300 | -0.309 | -0.427 | -0.480 |
|
-N+P: Nitrogen starved in the presence of P-factor -N-P: Nitrogen starved in the absence of P-factor |