pot1
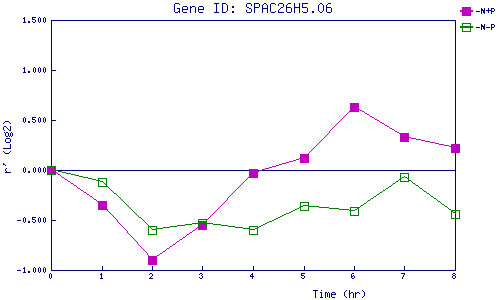
| 0 | 1 | 2 | 3 | 4 | 5 | 6 | 7 | 8 | |
| -N+P | 0.000 | -0.353 | -0.901 | -0.550 | -0.034 | 0.119 | 0.634 | 0.327 | 0.224 |
| -N-P | 0.000 | -0.121 | -0.601 | -0.531 | -0.602 | -0.355 | -0.408 | -0.068 | -0.437 |
|
-N+P: Nitrogen starved in the presence of P-factor -N-P: Nitrogen starved in the absence of P-factor |