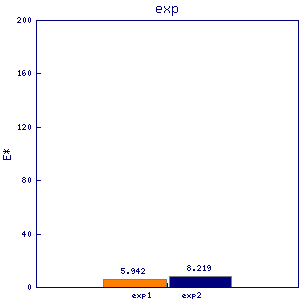
bgl2
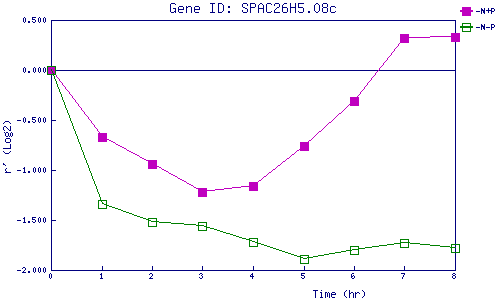
| 0 | 1 | 2 | 3 | 4 | 5 | 6 | 7 | 8 | |
| -N+P | 0.000 | -0.673 | -0.938 | -1.216 | -1.155 | -0.764 | -0.309 | 0.321 | 0.334 |
| -N-P | 0.000 | -1.339 | -1.518 | -1.558 | -1.719 | -1.889 | -1.802 | -1.733 | -1.776 |
|
-N+P: Nitrogen starved in the presence of P-factor -N-P: Nitrogen starved in the absence of P-factor |