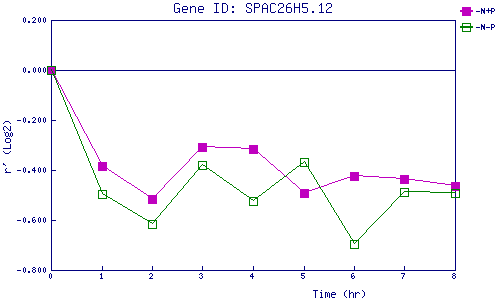
| 0 | 1 | 2 | 3 | 4 | 5 | 6 | 7 | 8 | |
| -N+P | 0.000 | -0.385 | -0.517 | -0.309 | -0.316 | -0.491 | -0.423 | -0.436 | -0.464 |
| -N-P | 0.000 | -0.497 | -0.618 | -0.379 | -0.524 | -0.368 | -0.694 | -0.488 | -0.492 |
|
-N+P: Nitrogen starved in the presence of P-factor -N-P: Nitrogen starved in the absence of P-factor |